This website was created as a project for Genetics 677, an undergraduate course at UW Madison.
DNA Microarrays
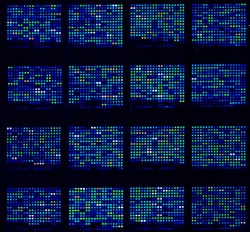
DNA microarrays are becoming more and more popular as significant portions of scientific research are dedicated to high-throughput screening methods. The strategic advantage is time and cost; DNA microarrays are inexpensive to make and can test for the presence of thousands of genes in a single sample. A DNA microarray is constructed by spotting a glass slide or membrane with single-stranded DNA oligonucleotides complementary to the genes of interest. These oligonucleotides are made by isolating mRNA from a tissue sample and using reverse transcriptase to synthesize cDNA with fluorescently labeled nucleotides. The array can then be analyzed using fluorescent DNA or RNA probes, and a machine measures the fluorescence intensity at each spot to determine relative abundance of a sequence. DNA microarrays are often used to compare levels of gene expression between two tissues, but can also detect single nucleotide polymorphisms and resequence mutant genomes, among others. Gene Expression Omnibus (GEO) serves as a public storage program for a wide-range of high-throughput data. In this case, WRN was entered as a query into the GEO search engine, which provided many DNA microarray experiments that involved the WRN gene or respective homologues. Two of these experiments were chosen as a reference because they directly assayed for human WRN.
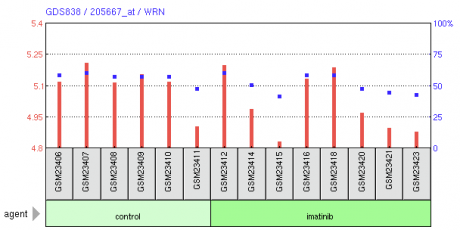
Figure 1. DNA microarray experiment showing Imanitib effects on WRN levels in chronic myelogenous leukemia CD34+ cells versus healthy donors. Red lines represent single channel transformed count, blue dots represent percentile rank within the sample.
Analysis: Two DNA microarray experiments were chosen that highlighted an assay for WRN. Figure 1 displays the first study, which examined the effects of a drug called imatinib (known as Gleevec in the United States) on chronic myelogenous leukemia cells compared to a control group. The results of the array are not definitive, but it appears that WRN expression is slightly reduced in the imatinib treated samples. The second study examined the expression of WRN in skin fibroblast cells taken from patients with Marfan syndrome compared to a control group. The array is too large to display as an image, but the interactive data can be found here. Again, the array is difficult to read, but it appears that the percentile ranks are approximately equivalent, and that the Marfan syndrome group had slightly decreased WRN expression levels. Although these two studies are interesting and are good examples of the applications of DNA microarrays, they did not produce any meaningful data concerning WRN. Furthermore, the expression levels seen in the two studies cannot be compared because they differ in experimental methods and purpose. Future DNA microarrays that focus more specifically on WRN could provide more knowledge regarding the gene as well as potential drug treatments.
References
1. (Title Figure) DNA microarray. Retrieved March 19, 2010 from http://serc.carleton.edu/images/cismi/bioinformatics/dna_microarray.jpg
2. Edgar R, Domrachev M, Lash AE.
Gene Expression Omnibus: NCBI gene expression and hybridization array data repository Nucleic Acids Res. 2002 Jan 1;30(1):207-10
3. Barrett T, Troup DB, Wilhite SE, Ledoux P, Rudnev D, Evangelista C, Kim IF, Soboleva A, Tomashevsky M, Marshall KA, Phillippy KH, Sherman PM, Muertter RN, Edgar R. NCBI GEO: archive for high-throughput functional genomic data
Nucleic Acids Res. 2009 Jan;37(Database issue):D5-15
4. (Figure 1) DNA microarray, Imanitib effects on chronic myelogenous leukemia. Retrieved March 19, 2010.
